Amazon has turned selling into a data game. The brands that win are the ones that can turn messy marketplace numbers into clear decisions about products, ads, pricing, and inventory.
In this guide, we’ll walk through what “Amazon analytics” actually means, how Amazon itself uses data, and how sellers can choose the best amazon analytics tools and workflows for 2025–2026.
Contents
- What Is Amazon Analytics and Why It Matters
- Types of Analytics Tools for Amazon Sellers
- Amazon Brand Analytics Explained
- Best Amazon Analytics Tools & Software in 2025
- How to Choose an Amazon Analytics Tool
- How to Implement Analytics in Your Amazon Business Strategy
- Challenges & Limitations of Amazon Analytics Data
- Conclusion: Data-Driven Decisions Lead to Sustainable Growth
What Is Amazon Analytics and Why It Matters
At a basic level, “Amazon analytics” is the process of turning marketplace data into decisions about what to sell, how to price, and where to invest.
You are not just tracking sales. You are using business analytics in Amazon to connect ads, conversions, returns, fees, and inventory into a coherent story about profit.
When you understand where is business analytics in Amazon and how Amazon structures data, you can choose tools and workflows that match your goals instead of drowning in spreadsheets.
How Amazon Uses Business Analytics to Boost Sales
To understand your own stack, it helps to see how Amazon uses business analytics internally.
Amazon uses massive datasets to:
-
Rank search results based on conversion, relevance, and profitability
-
Personalize recommendations and “Frequently Bought Together” widgets
-
Optimize FBA capacity, inventory placement, and shipping promises
-
Adjust retail prices and promotions at scale
In other words, how Amazon uses business analytics is to maximize customer satisfaction and Amazon’s own margins. Sellers need their own analytics layer to optimize for their brand’s profit, not just Amazon’s goals.
Where Business Analytics Is Applied in Amazon’s Marketplace
If you have ever wondered where is business analytics in Amazon, the answer is: almost everywhere you interact with as a seller.
Data-driven logic sits behind:
-
The search results your products compete in
-
The Buy Box rotation and price matching
-
Advertising auctions and suggested bids
-
Restock recommendations and capacity limits
Understanding this helps you see why business analytics in Amazon is so critical. You’re competing against algorithms, not just other brands.
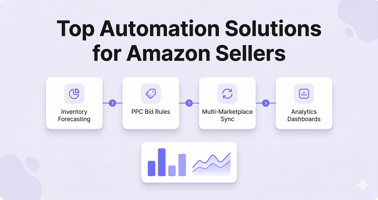
Types of Analytics Tools for Amazon Sellers
Sellers are often overwhelmed by “tool bloat.” A clear mental map of tool types will help you pick the best tools for Amazon seller analytics for your situation.
Amazon-Native Analytics Tools Overview
Amazon provides several built-in analytics sources:
-
Seller Central Business Reports
-
Amazon Advertising reports
-
Retail Analytics in Vendor Central (for vendors)
-
Amazon Brand Analytics dashboards in Brand Registry
Every Amazon brand analytics report is free for eligible brands and lives inside Seller Central. These reports cover search behavior, repeat purchases, demographics, and more.
However, Amazon-native tools focus on the Amazon silo. They usually don’t join up with your accounting, inventory across channels, or true landed costs.
Third-Party Amazon Seller Analytics Software
Third-party tools extend Amazon data, fill gaps, and automate insights.
Roundups like RevenueGeeks’ comparison and AiHello’s guide to 20 tools show just how crowded this space has become.
Most third-party options fall into a few buckets:
-
Product research and keyword tools
-
PPC optimization and attribution platforms
-
Profit and P&L dashboards
-
Multi-channel inventory and finance platforms, such as NeonPanel, that combine analytics with operations and accounting
Choosing the best Amazon analytics software for you depends on which decisions you want to automate first.
Amazon Brand Analytics Explained
Amazon Brand Analytics (ABA) is a suite of dashboards for brand-registered sellers. It focuses on customer behavior, search queries, and repeat purchase patterns.
ABA is not a single Amazon brand analytics report but a collection of them.
Key dashboards include:
-
Search Query Performance and Top Search Terms
-
Market Basket Analysis and Repeat Purchase Behavior
-
Demographics and Geographic Sales Insights
How to Use Amazon Brand Analytics for Growth
Many brands still ask how to use Amazon brand analytics in a practical, day-to-day way.
Here is a simple workflow:
-
Use Search Query Performance to find high-opportunity keywords with strong impressions but weaker click or conversion rates.
-
Improve titles, images, and bullets to close the gap.
-
Adjust PPC bids so your top keywords get enough visibility.
-
Use Market Basket Analysis to spot natural bundles and cross-sell ideas.
-
Apply Demographics data to refine creatives, messaging, and off-Amazon targeting.
If you turn this into a weekly ritual, how to use Amazon brand analytics becomes less about dashboards and more about a repeatable optimization loop.
Which Geographic Sales Data Can Amazon Brand Analytics Report On
A common question is Amazon brand analytics can report on which geographic sales data.
In the Geographic Sales Insights view, ABA can show you:
-
Which states, cities, and ZIP codes your orders ship to
-
How sales vary by region and over time
-
How different geographies respond to price and promotions
So if you are wondering again, Amazon brand analytics can report on which geographic sales data, think in terms of shipping destination granularity: state, city, and ZIP in many marketplaces.
Key Amazon Brand Analytics Reports Every Seller Should Track
Every Amazon brand analytics report has a purpose, but some are higher leverage for most brands:
-
Search Query Performance – Understand how shoppers move from search to click to purchase.
-
Top Search Terms – Spot new keyword opportunities and rising trends.
-
Market Basket Analysis – Discover which ASINs are often bought together.
-
Repeat Purchase Behavior – Identify replenishment items and loyal customers.
-
Demographics – See the age, gender, location, and income profile of customers.
Pull at least one Amazon brand analytics report each week and turn the insights into specific listing, pricing, or campaign tests.
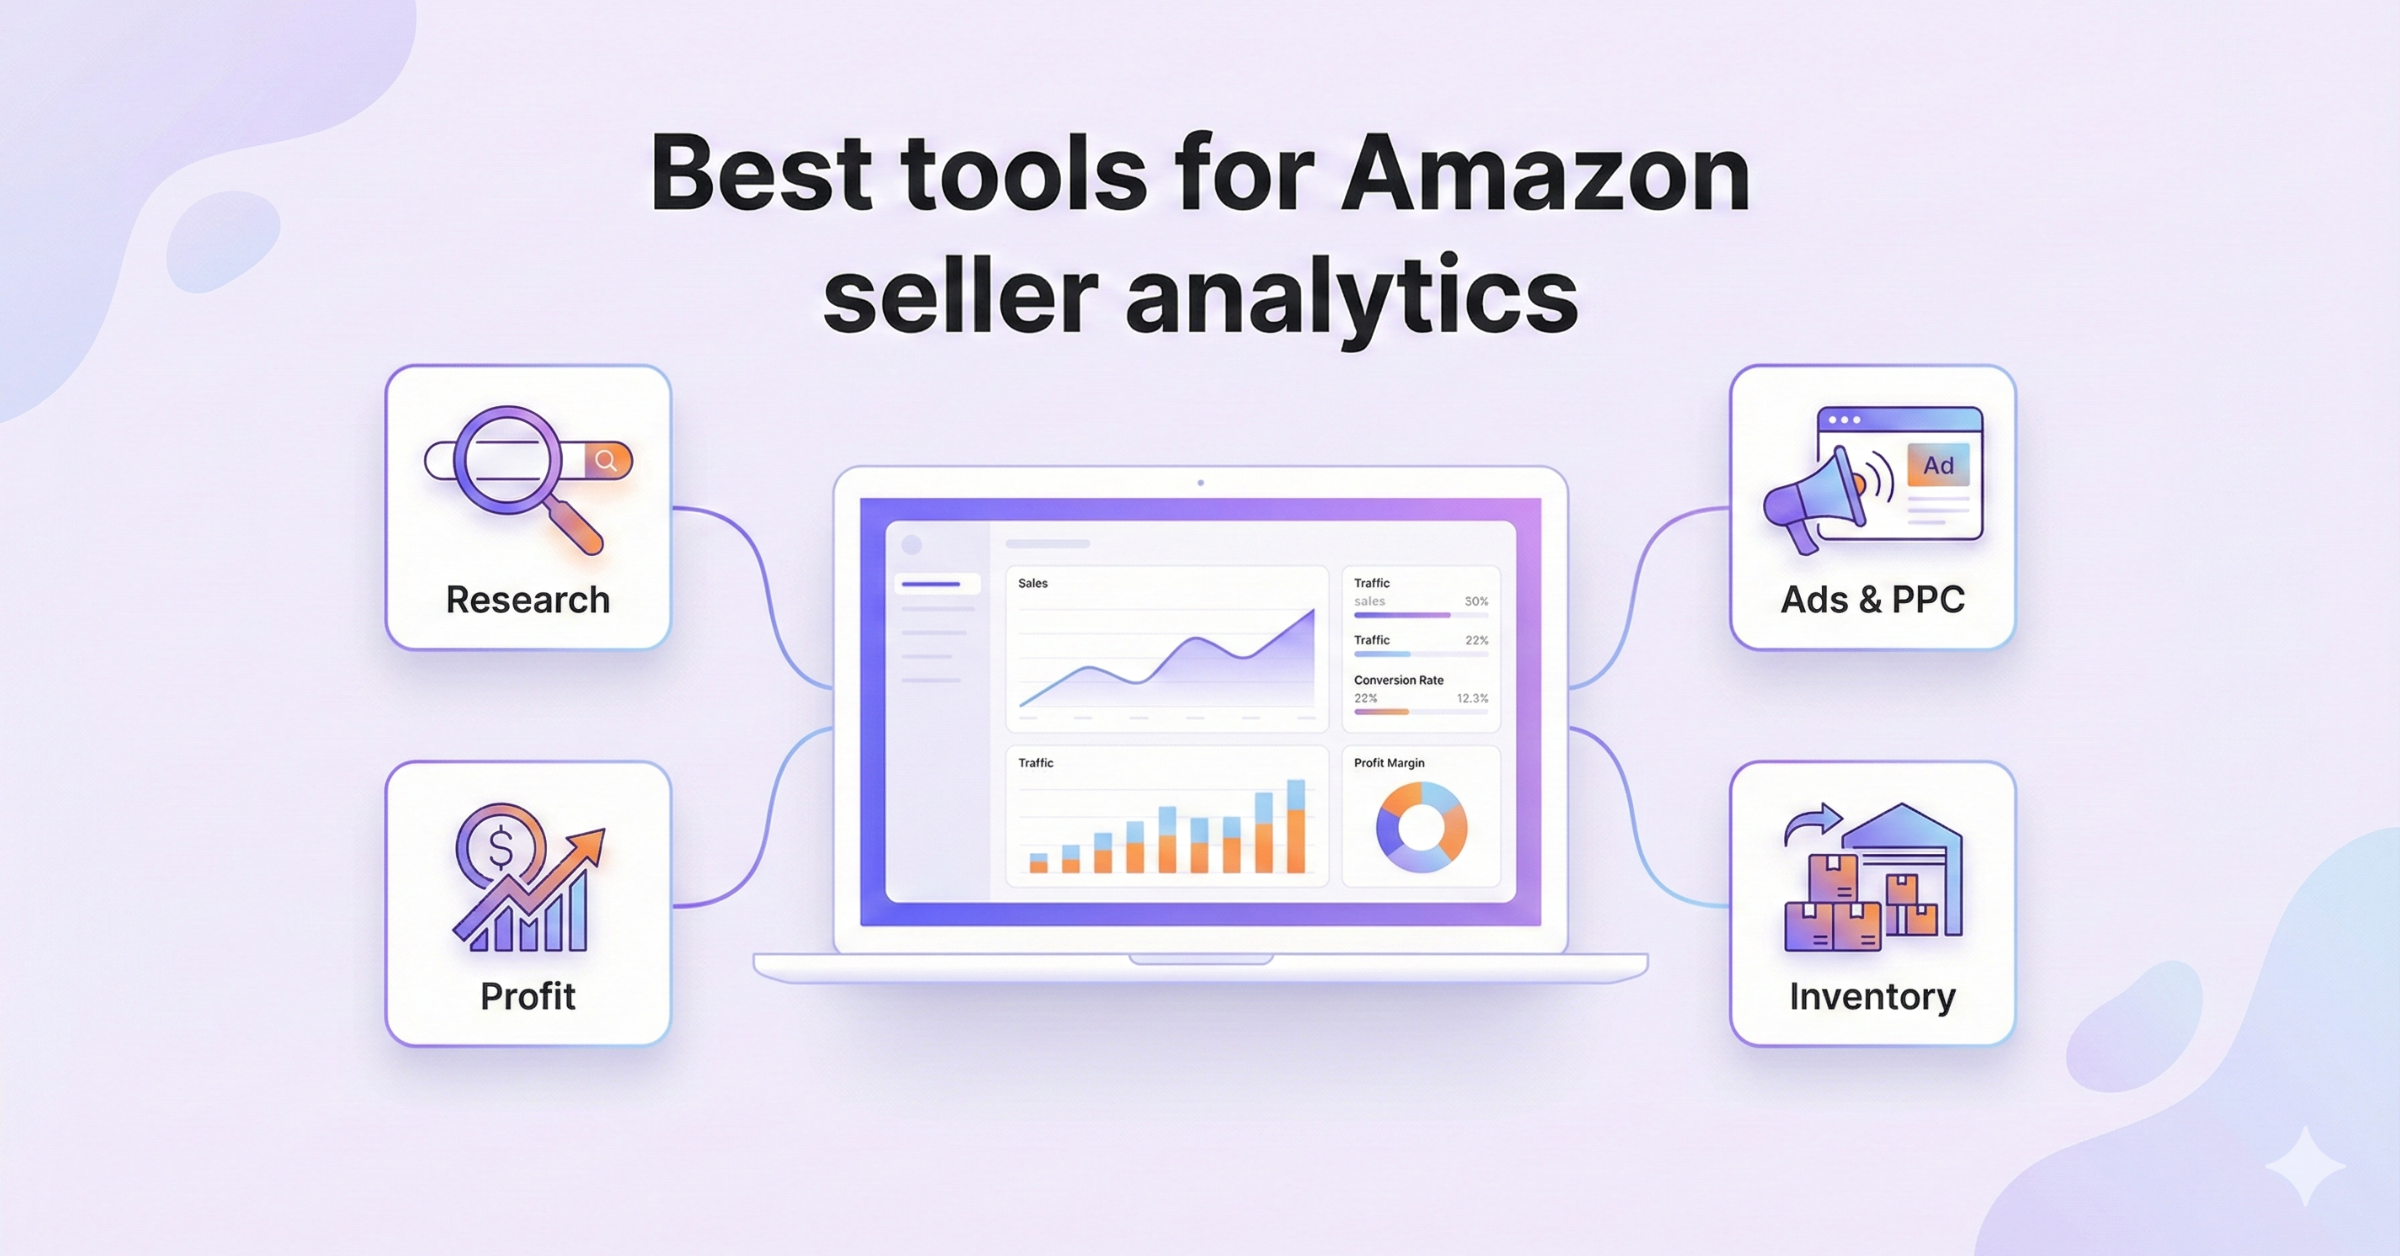
Best Amazon Analytics Tools & Software in 2025
When people search for best Amazon analytics tools, they usually want a shortlist that covers research, ads, and profitability.
In practice, the best Amazon analytics software stack is rarely one tool. It’s a combination that maps to your margins, catalog complexity, and growth plans.
Top Tools for Amazon Seller Analytics
Most “top tool” lists highlight a similar core set:
-
Helium 10 and Jungle Scout for research and tracking
-
Sellerboard or similar for profit analytics
-
SmartScout, DataHawk, and others for category and brand research
The best tools for Amazon seller analytics share a few traits:
-
Clear dashboards focused on decisions, not just pretty charts
-
Transparent profit and fee calculations
-
Strong keyword, ranking, and share-of-voice data
-
Reliable exports and integrations
For multi-channel brands that also care about landed cost and accounting, tools like NeonPanel act as the analytics “command center.” They combine inventory tracking, automatic FBA and AWD shipment processing, and SKU-level profitability across marketplaces and currencies.
Compared with generic profit dashboards, this kind of stack can be one of the best tools for Amazon seller analytics if you need both operational and financial clarity.
Amazon Marketplace Analytics Tools for Competitive Research
An Amazon marketplace analytics tool for competitive research focuses on understanding the landscape, not just your own account.
Typical features include:
-
Brand and category share of voice
-
ASIN-level sales estimates and BSR tracking
-
Seller and storefront scouting
-
Historic pricing and review trends
For wholesale, private label expansion, or brand acquisition, an Amazon marketplace analytics tool helps you size opportunities and evaluate risk before you commit capital.
Amazon Analytics Tracking Tools for Keyword and Ranking Insights
You will also see a subcategory of tools marketed as Amazon analytics tracking tools.
They specialize in:
-
Monitoring organic ranks for target keywords
-
Tracking keyword coverage across your catalog
-
Comparing share of voice versus key competitors
-
Sending alerts when you lose ranking or Buy Box share
Good Amazon analytics tracking tools turn rank and keyword movement into clear alerts and workflows so your team can react quickly.
How to Choose an Amazon Analytics Tool
With so many options, how to choose an Amazon analytics tool becomes a strategic question, not just a pricing one.
Instead of starting with a tool list, start with your decisions. Which decisions do you want software to improve or automate this quarter?
Only after that should you ask again how to choose an Amazon analytics tool that fits your team, budget, and tech stack.
Essential Features for Data-Driven Selling
When you compare candidates, focus on features that support data-driven selling, not just “nice dashboards.”
At minimum, your short list of best Amazon analytics tools should offer:
-
Clean, reliable data pulled directly from Amazon’s APIs
-
Visibility into fees, refunds, and promotions, not just revenue
-
SKU-level profit views and cost assumptions you can control
-
Multi-marketplace coverage if you sell in several regions
-
Export options and integrations with accounting, BI, or inventory tools
These criteria will filter out a lot of noise and leave you with the truly best Amazon analytics software for your model.
Matching Analytics Software to Your Selling Strategy
Not every brand needs the same stack.
-
A single-market, single-brand seller may be fine with one PPC tool and one profit dashboard.
-
Aggregators and advanced private-label brands often need a more robust Amazon marketplace analytics tool plus finance-grade profitability.
-
Hybrid brands selling on Amazon, Shopify, and TikTok may benefit from a unified inventory and finance platform that consolidates analytics across channels.
The key is to match the best tools for Amazon seller analytics to your growth strategy and team structure, not to chase every shiny feature.
How to Implement Analytics in Your Amazon Business Strategy
Great tools are useless without a clear implementation plan.
Think beyond “installing software” and define how analytics will plug into your weekly and monthly routines.
Using Insights for Product Optimization
Start with product pages and ad performance.
Use ABA and your Amazon analytics tracking tools to:
-
Identify underperforming keywords and improve titles and bullets
-
Test main images, price points, and coupons
-
Refine targeting in Amazon Ads based on real search behavior
When your whole team understands how to use Amazon brand analytics to drive specific listing updates, you get compounding gains instead of random experiments.
Predictive Analytics for Demand, Pricing & Inventory
Once basics are in place, layer in predictive analytics.
Many advanced tools now estimate:
-
Future demand based on seasonality, lead times, and promotion plans
-
Recommended reorder points and purchase order quantities
-
Pricing scenarios based on competitor moves and ad performance
Platforms like NeonPanel go further by tying these forecasts to batch-level landed costs, FIFO COGS, and multi-warehouse inventory, so you can see financial impact before you act.
This is where business analytics in Amazon meets real-world decisions about cash flow and working capital.
Challenges & Limitations of Amazon Analytics Data
Even the best Amazon analytics tools are only as good as the data underneath.
Sellers should be aware of common limitations:
-
Some reports are aggregated or sampled rather than raw event data
-
Time lags mean today’s actions may not show for days or weeks
-
ABA and advertising data rarely tie cleanly to accounting and COGS
-
Cross-channel behavior is often invisible in Amazon-only tools
That is why many brands connect Amazon data to an inventory and finance layer that tracks stock movements, landed costs, and COGS consistently across channels.
Without this foundation, how Amazon uses business analytics at the platform level can feel very different from the messy reality of your P&L.
Conclusion: Data-Driven Decisions Lead to Sustainable Growth
Amazon will keep getting more competitive. The sellers who thrive will be those who build a focused, intentional analytics stack instead of a random mix of tools.
To recap:
-
Use native Amazon reports, especially ABA, as your starting point.
-
Layer in third-party Amazon analytics tracking tools and profit dashboards where they clearly support specific decisions.
-
Choose the best Amazon analytics tools and best Amazon analytics software for your size, catalog, and tech stack, not just based on popularity lists.
-
Make sure your analytics connect to inventory, COGS, and accounting, so you can see true profitability by SKU and channel.
If you follow these principles, the question is no longer how to choose an Amazon analytics tool, but how fast you can execute on the insights.